Features of a Gantt Chart
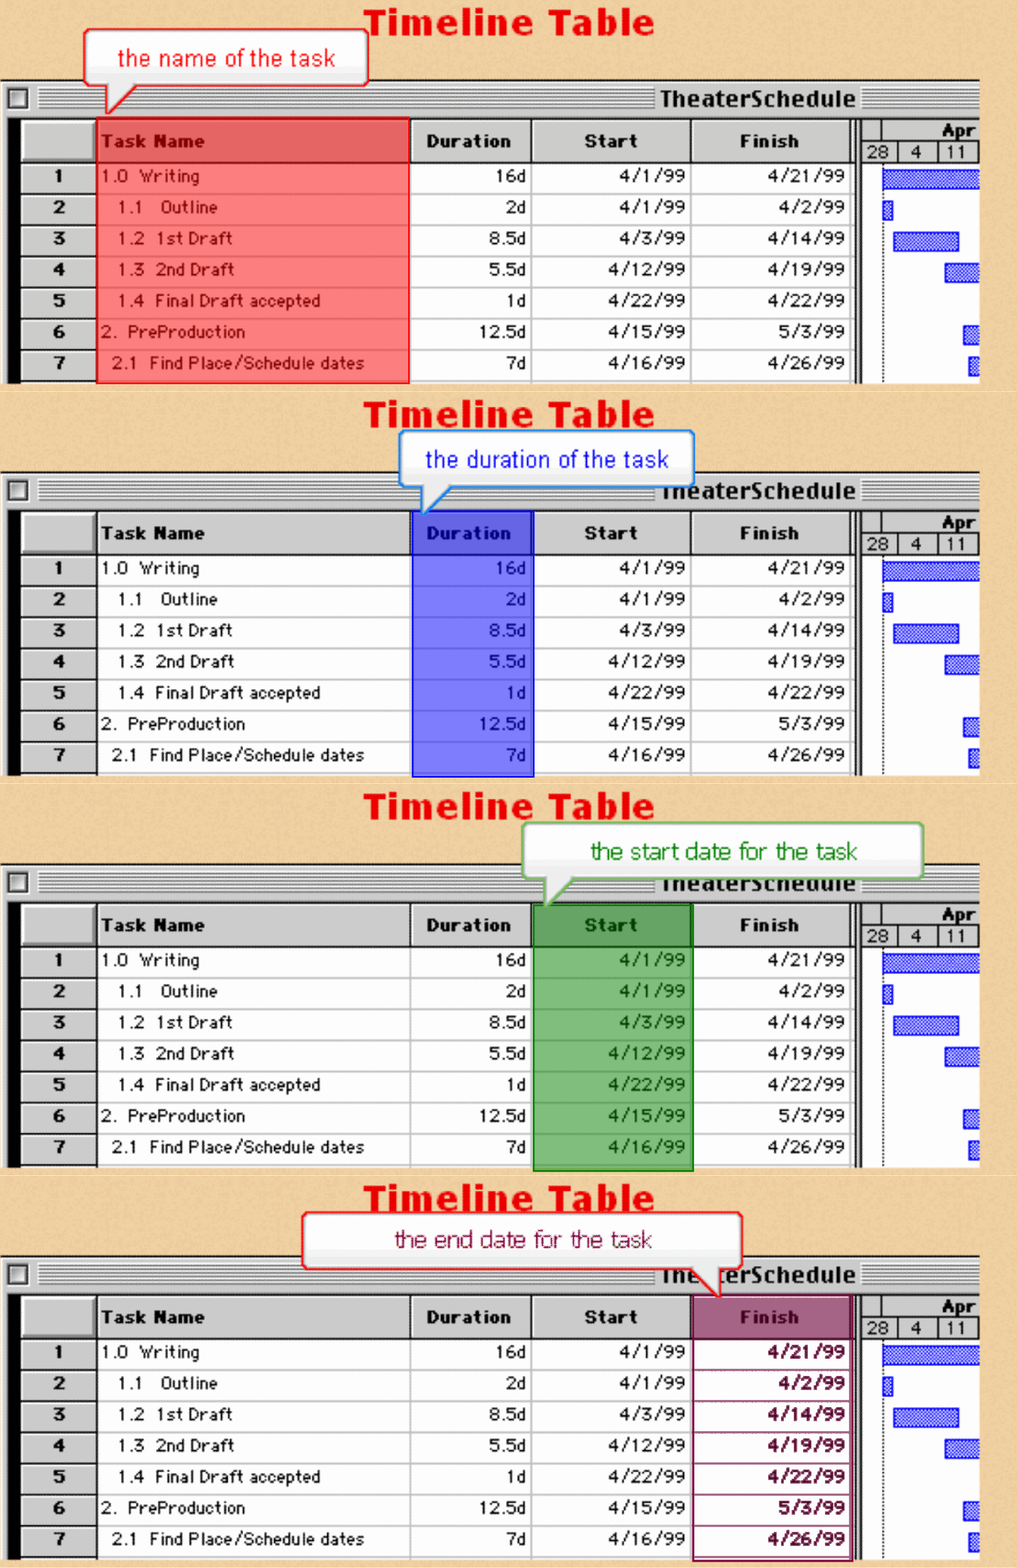
Timeline Table:
The timeline table shows tasks in a spreadsheet-like table where you can add, delete, organize, and sort tasks. This table can contain many different columns of information. The most common columns of information are: the name of the task, the duration of the task, the start date of the task, and the end date of the task. For larger projects, main tasks can be divided up into subtasks in order to maintain readability. Each subtask is one step needed to accomplish the main task. Subtasks can also be broken into smaller steps. In a Gantt Chart, tasks should be laid out in the order which they need to be carried out.

Timeline Bar Chart:
The timeline bar chart shows Gantt bars and other symbols representing the time schedule, relationships and progress information for each task.
Gantt Bar:
A Gantt bar represents a task graphically. It shows the task duration. It can show the type of task, such as a critical task or a milestone. Bars can also represent planned and actual start dates, percent of task completed, planned and actual finish dates, slack time, and many more concepts.
Current Date Line:
The current date line shows today's date on the bar chart. For example, if today's date is April 7, then the 7 in the timeline bar chart would be highlighted.
Time Scale:
The time scale controls the intervals of time shown. The time scale can be hours, days, weeks, months, years, or a combination thereof.
Milestone:
A milestone is an important goal date or a checkpoint in the project, such as a task completion date. When reached, a milestone is often treated as a time to celebrate. Milestones are often designated as special symbols that you can choose.
Visit ganttchart.com for a variety of Gantt Chart examples.


