iStudy for Success!
Online learning tutorials for essential college skills.
iStudy would like to acknowledge Glenna Emel for revising the content of this tutorial.
Gantt Chart help organize and schedule time for complex projects. They are step-by-step visual timelines that are commonly used to breakdown different phases and stages of a project. The purpose of this tutorial is to help you understand what a Gantt Chart is and the different components it includes.
Upon completion of this tutorial, you will be able to:
Note: All external links in this tutorial will open in a new window or tab.
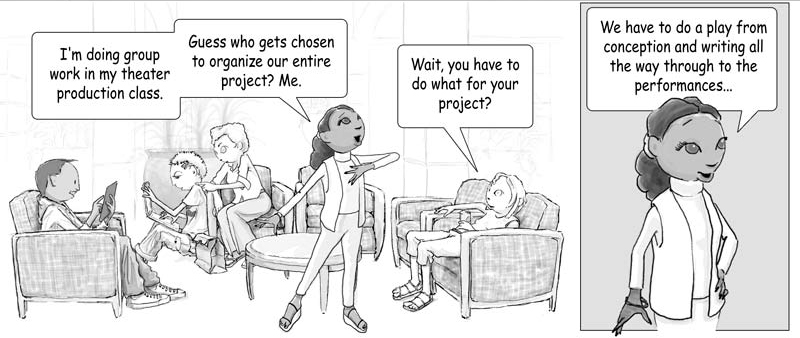
Heather: I'm doing group work in my theater production class. Guess who gets chosen to organize our entire project? Me.
Sage: Wait, you have to do what for your project?
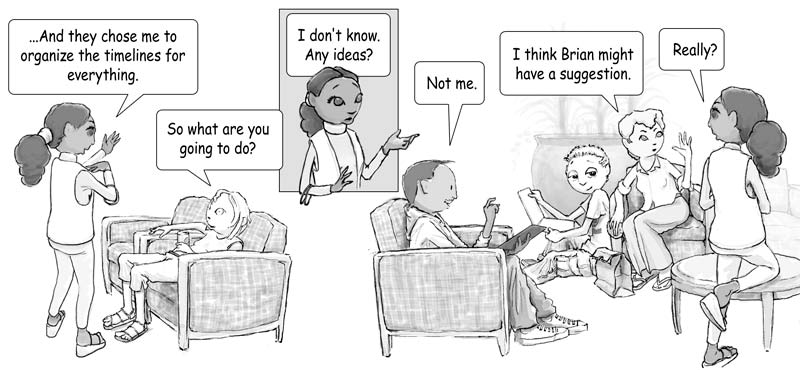
Heather: We have to do a play from conception and writing all the way through to the performances. And they chose me to organize the timelines for everything.
Sage: So what are you going to do?
Heather: I don't know. Any ideas?
Jose: Not me.
Deena: I think Brian might have a suggestion.
Heather: Really?
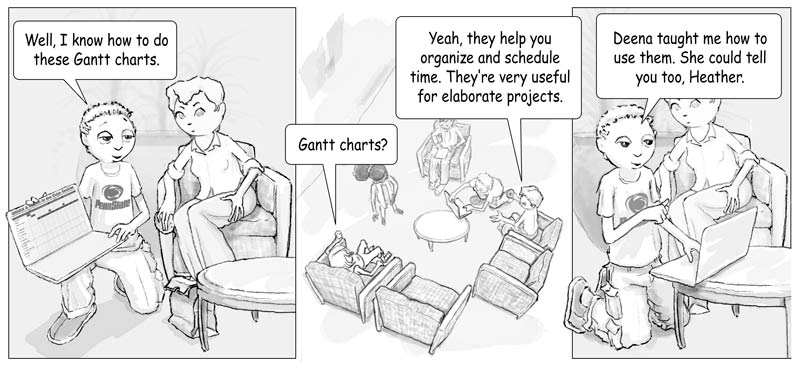
Brian: Well, I know how to do these Gantt Charts.
Sage: Gantt Charts?
Deena: Yeah, they help you organize and schedule time. They're very useful for elaborate projects.
Brian: Deena taught me how to use them. She could tell you too, Heather.
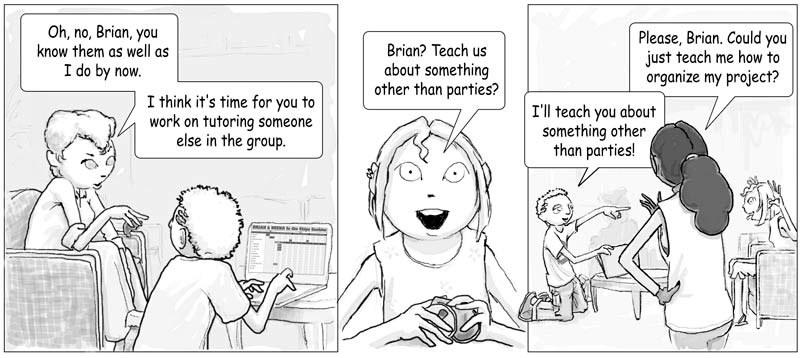
Deena: Oh, no, Brian, you know them as well as I do by now. I think it's time for you to work on tutoring someone else in the group.
Sage: Brian? Teach us about something other than parties?
Brian: I'll teach you about something other than parties!
Heather: Please, Brian. Could you just teach me how to organize my project?
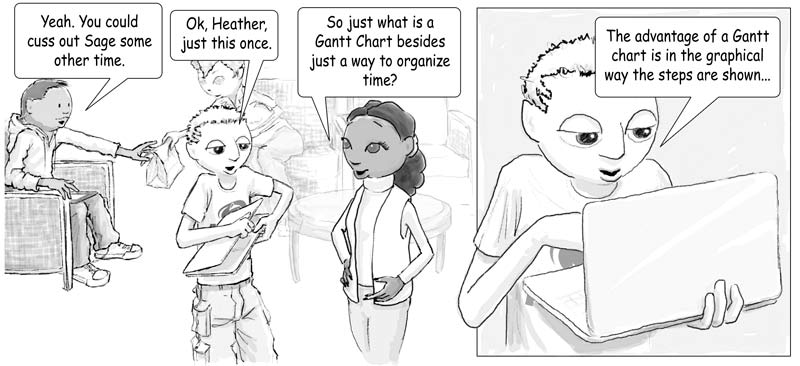
Jose: Yeah. You could cuss out Sage some other time.
Brian: Ok, Heather, just this once.
Heather: So just what is a Gantt Chart besides just a way to organize time?
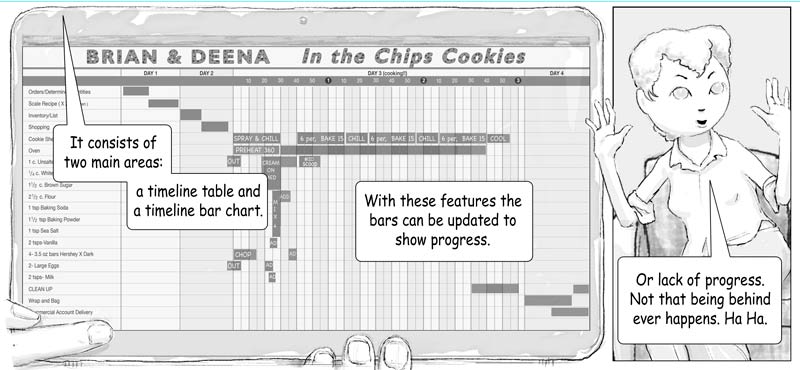
Brian: The advantage of a Gantt Chart is in the graphical way the steps are shown. It consists of two main areas: a timeline table and a timeline bar chart. With these features the bars can be updated to show progress.
Deena: Or lack of progress. Not that being behind ever happens. Ha Ha.
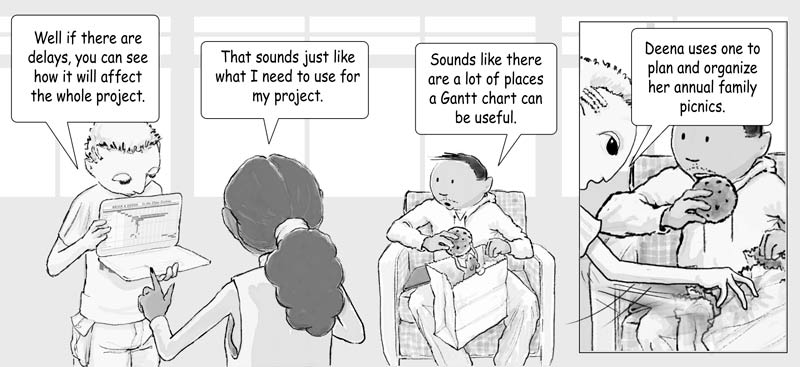
Brian: Well if there are delays, you can see how it will affect the whole project.
Heather: That sounds just like what I need to use for my project.
Jose: Sounds there are a lot of places a Gantt chart can be useful.
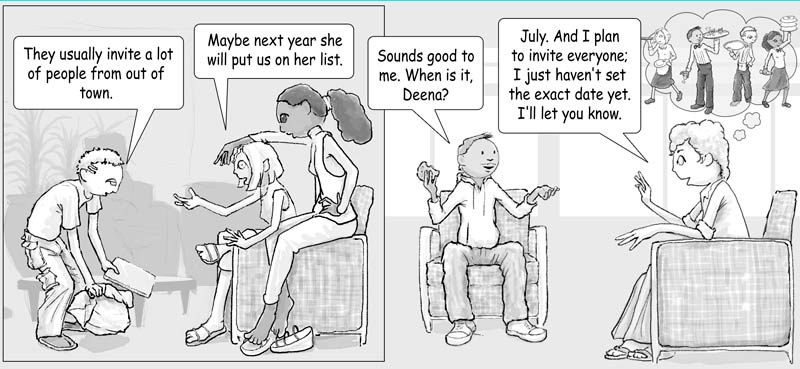
Brian: Deena uses one to plan and organize her annual family picnics. They usually invite a lot of people from out of town.
Sage: Maybe next year she will put us on her list.
Jose: Sounds good to me. When is it, Deena?
Deena: July. And I plan to invite everyone. I just haven't set the exact date yet. I'll let you know.
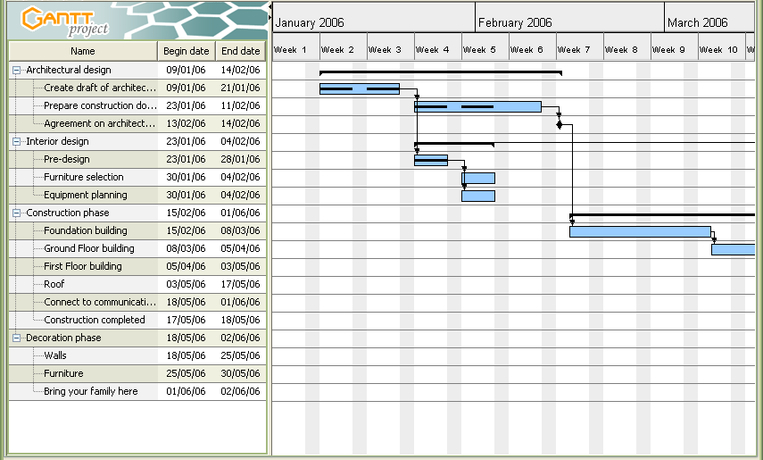
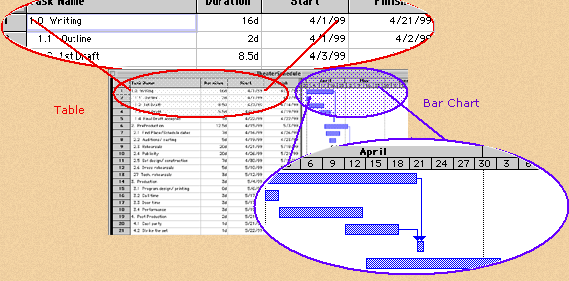
A Gantt Chart is a step-by-step visual timeline of all the activities included in a complex project. Its two main components - a timeline table and a timeline bar chart - present the information both textually and graphically. A Gantt Chart normally includes the project's start and finish dates, as well as its terminal and summary tasks. Each step is shown graphically as a bar against a horizontal time scale.
As progress is made, the bar can be updated to show the status of each task, and a vertical line can be drawn to show the current point in time. By comparing the progress indicated on the horizontal bars with the line showing the current point in time, users can visualize whether tasks are on schedule, ahead of schedule, or behind schedule.
The timeline table shows tasks in a spreadsheet-like table where you can add, delete, organize, and sort tasks. This table can contain many different columns of information. The most common columns of information are: the name of the task, the duration of the task, the start date of the task, and the end date of the task. For larger projects, main tasks can be divided up into subtasks in order to maintain readability. Each subtask is one step needed to accomplish the main task. Subtasks can also be broken into smaller steps. In a Gantt Chart, tasks should be laid out in the order which they need to be carried out.
The timeline bar chart shows Gantt bars and other symbols representing the time schedule, relationships and progress information for each task.
A Gantt bar represents a task graphically. It shows the task duration. It can show the type of task, such as a critical task or a milestone. Bars can also represent planned and actual start dates, percent of task completed, planned and actual finish dates, slack time, and many more concepts.
The current date line shows today's date on the bar chart. For example, if today's date is April 7, then the 7 in the timeline bar chart would be highlighted.
The time scale controls the intervals of time shown. The time scale can be hours, days, weeks, months, years, or a combination thereof.
A milestone is an important goal date or a checkpoint in the project, such as a task completion date. When reached, a milestone is often treated as a time to celebrate. Milestones are often designated as special symbols that you can choose.
Visit ganttchart.com for a variety of Gantt Chart examples.
When creating a Gantt Chart, it is a good idea to list your tasks first and then place them in order from first to last. Try this with the tasks below. You decide to host a summer picnic on June 28. Here is your list of things "to do":
A Gantt Chart is a step-by-step graphical representation of a proposed project. The most basic parts of a Gantt Chart include the timeline table, timeline bar chart, Gantt bar, current date line, time scale, and milestones. When creating and using a Gantt chart, keep the following in mind:
The following assignments are embedded in the Gantt Chart tutorial:
This tutorial is related to other iStudy tutorials on time management and stress management. Therefore, it is recommended that instructors introduce this tutorial to students in conjunction with these other tutorials.
These points are covered in the iStudy tutorial but should be emphasized in any discussions:
The iStudy tutorial includes two activities instructors may find appropriate as models for assessment devices. Variations of the activities can be reproduced on paper or as online activities.
Assessment criteria are as follows (Instructors supply the percentage weights):
|
Where |
Domain |
Activities |
% |
|---|---|---|---|
|
Content of iStudy Tutorial |
Knowledge |
The student can identify the parts of a Gantt Chart. |
|
|
Activities in Class |
Comprehension |
The student can list projects in his/her life for which a Gantt Chart would be appropriate. |
|
|
Activities in Class |
Application |
The student can develop a Gantt Chart for a given project. |
|
|
|
|
|
100% |