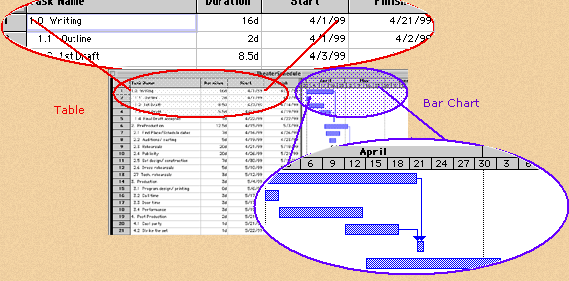
Defining a Gantt Chart
A Gantt Chart is a step-by-step visual timeline of all the activities included in a complex project. Its two main components - a timeline table and a timeline bar chart - present the information both textually and graphically. A Gantt Chart normally includes the project's start and finish dates, as well as its terminal and summary tasks. Each step is shown graphically as a bar against a horizontal time scale.