More on Defining a Gantt Chart
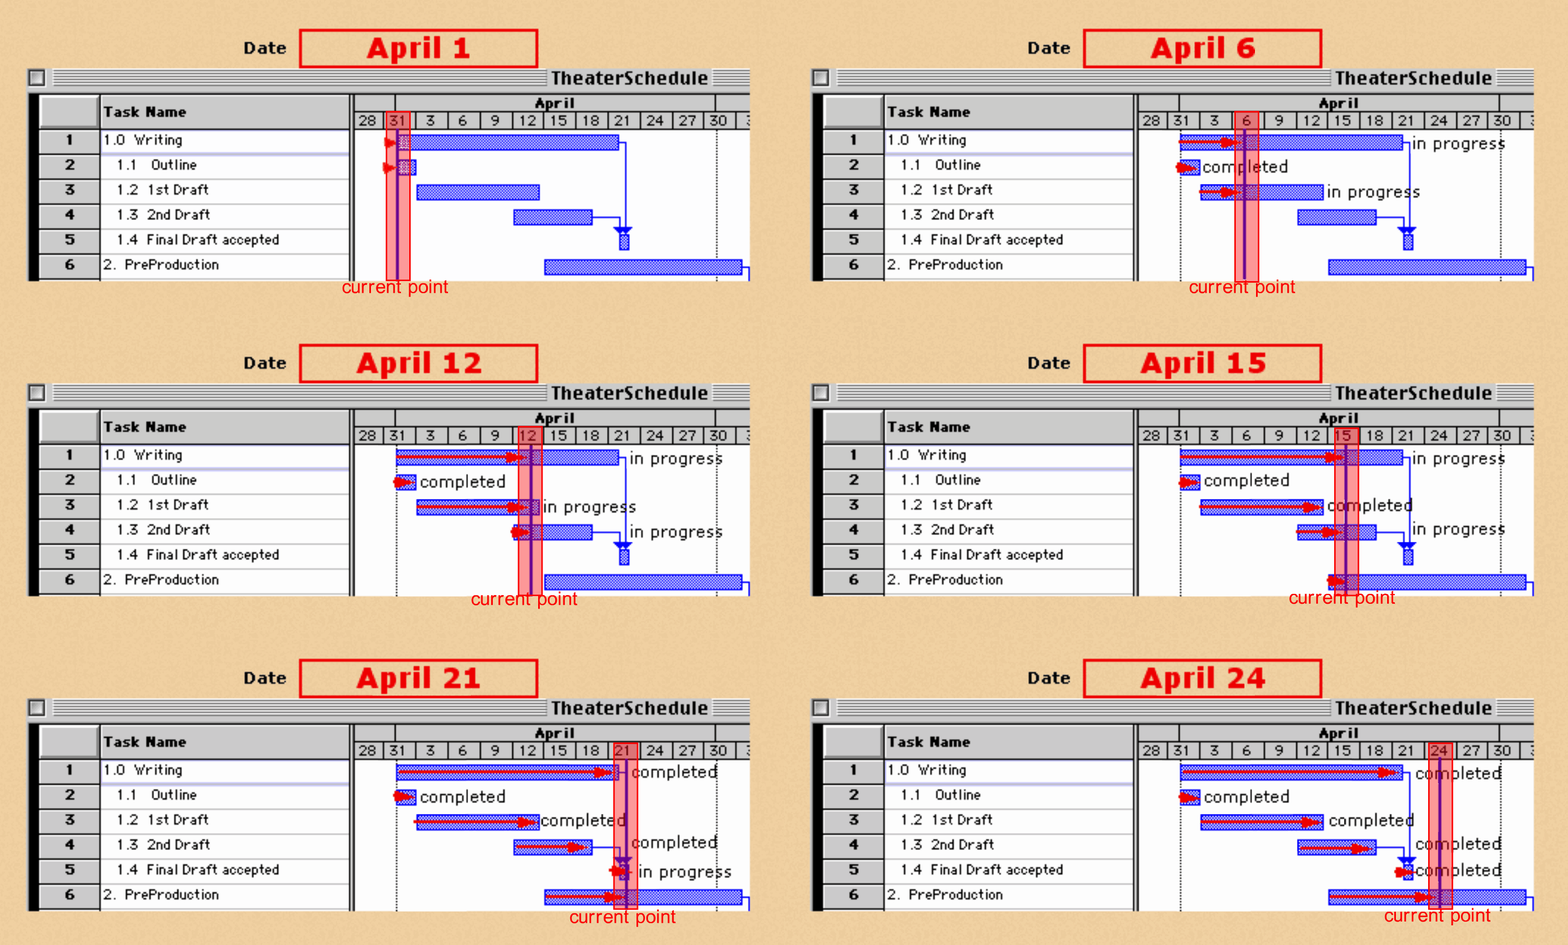
As progress is made, the bar can be updated to show the status of each task, and a vertical line can be drawn to show the current point in time. By comparing the progress indicated on the horizontal bars with the line showing the current point in time, users can visualize whether tasks are on schedule, ahead of schedule, or behind schedule.


