
Summary
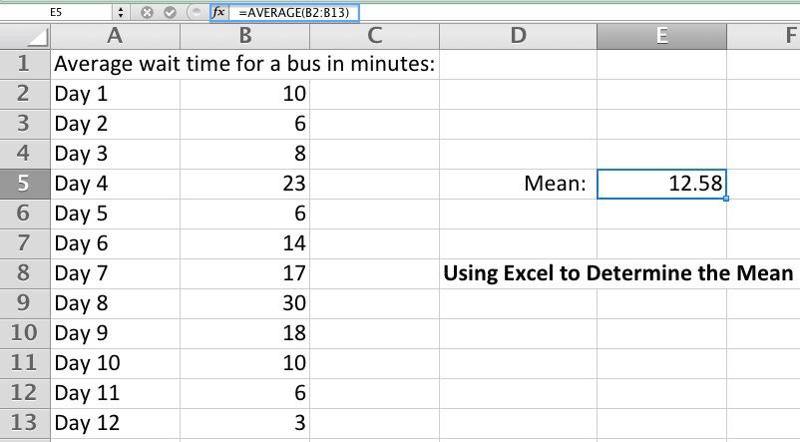
Mean—The average result of a test, survey, or experiment.
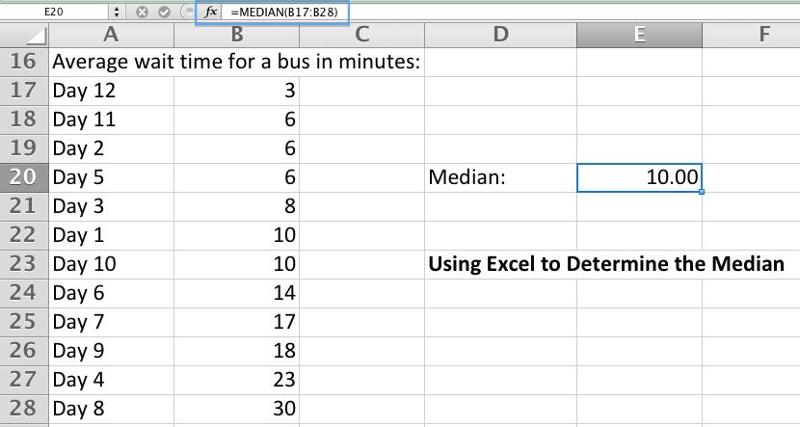
Median—The score that divides the results in half.
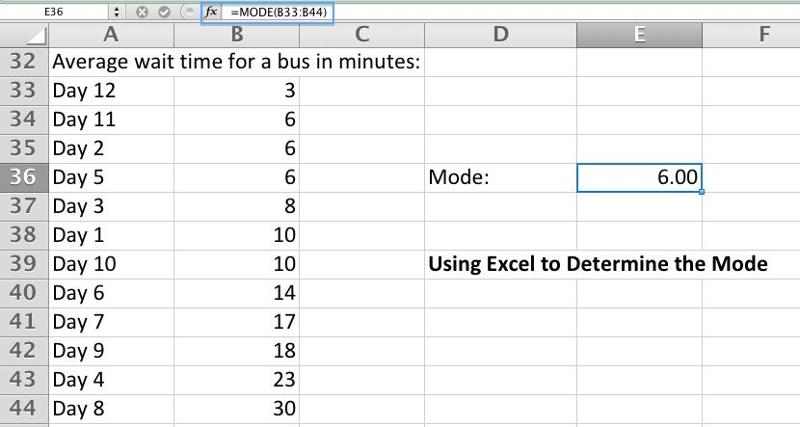
Mode—The most common result of a test, survey, or experiment.
Significance—The measure of whether the results of research were due to chance.
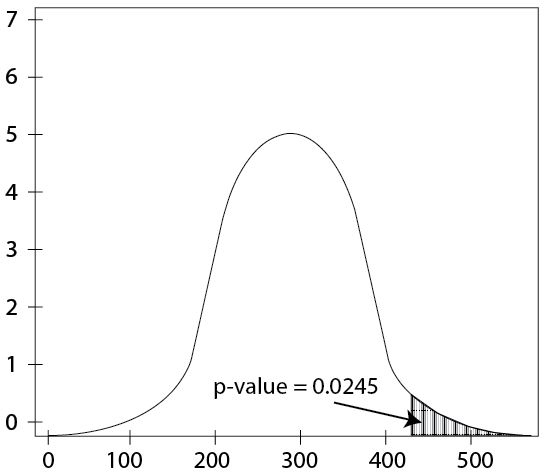
p-value—The way in which significance is reported statistically. For example, p<.01 means that there is a less than 1% chance that the results of a study are due to random chance.
Correlation—The degree to which two factors appear to be related.
r-value—The way that correlation is reported statistically. It's a number between –1 and +1. If r=0, there is little or no correlation between two variables. When the number is higher, the positive correlation between two variables is greater. Generally, r-values should be >.3 in order to report a significant positive correlation.

