 Statistical terms will play an increasingly important role throughout your college career. Understanding the terms and processes of statistics is necessary for you to understand your own research and the research of other scholars.
iStudy for Success!
Online learning tutorials for essential college skills.
iStudy would like to acknowledge Jackie Ritzko for revising the content of this tutorial.
Statistical terms will play an increasingly important role throughout your college career. Understanding the terms and processes of statistics is necessary for you to understand your own research and the research of other scholars.
Upon completion of this tutorial, you will be able to:
Read about mean, median, mode, significant differences, and correlations and complete the activities.
Note: All external links in this tutorial will open in a new window or tab.
N
"N" is usually used to indicate the number of subjects in a study. Example:
If you have 76 participants in a study, N=76.
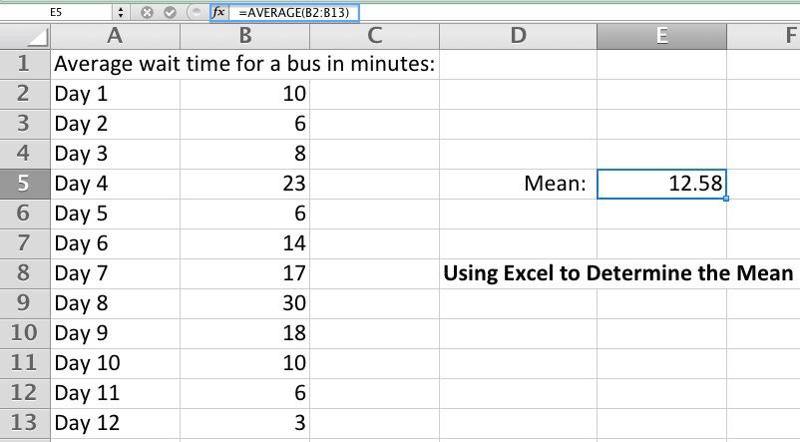
Mean
 The average result of a test, survey, or experiment.
Example:
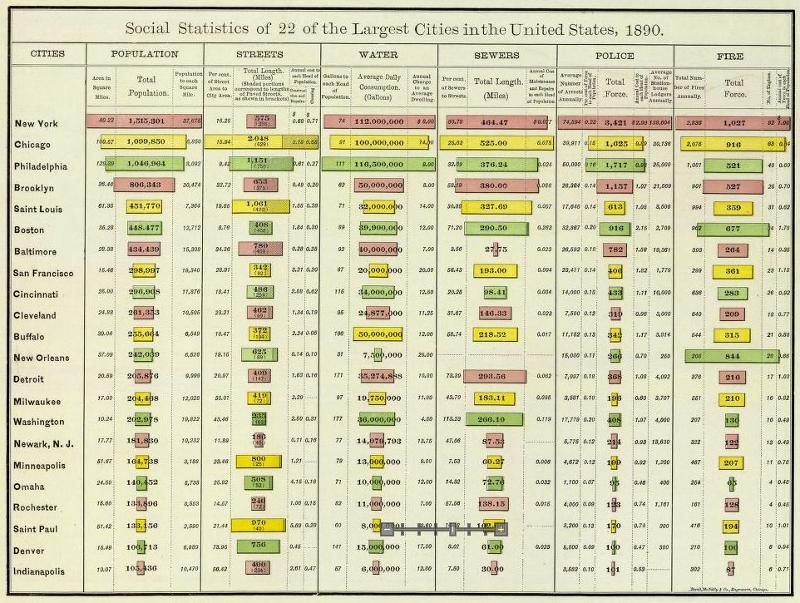
Heights of five people: 5 feet 6 inches, 5 feet 7 inches, 5 feet 10 inches, 5 feet 8 inches, 5 feet 8 inches.
The sum is: 339 inches.
Divide 339 by 5 people = 67.8 inches or 5 feet 7.8 inches.
The mean (average) is 5 feet 7.8 inches.
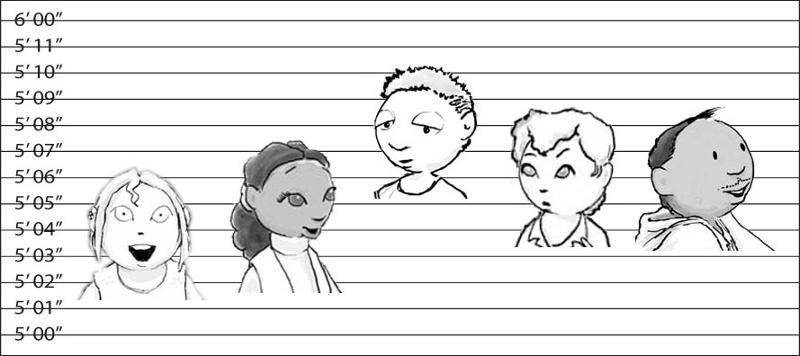
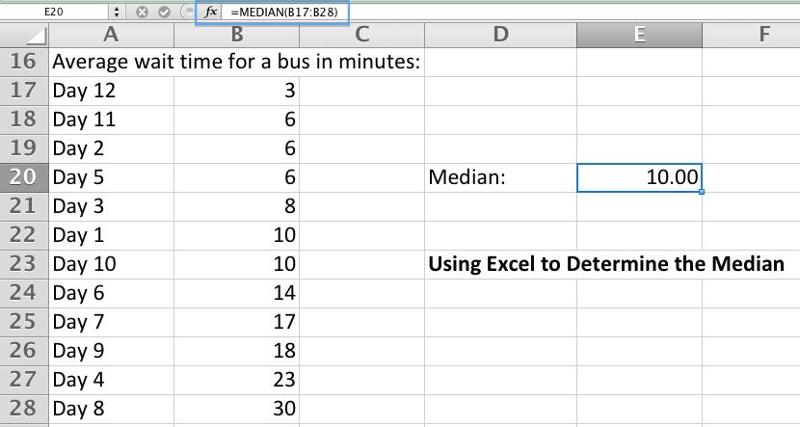
Median
The score that divides the results in half - the middle value.
Examples:
Odd amount of numbers: Find the median of 5 feet 6 inches, 5 feet 7 inches, 5 feet 10 inches, 5 feet 8 inches, 5 feet 8 inches.
Line up your numbers from smallest to largest: 5 feet 6 inches, 5 feet 7 inches, 5 feet 8 inches, 5 feet 8 inches, 5 feet 10 inches.
The median is: 5 feet 8 inches (the number in the middle).
Even amount of numbers: Find the median of 7, 2, 43, 16, 11, 5
Line up your numbers in order: 2, 5, 7, 11, 16, 43
Add the 2 middle numbers and divide by 2: 7 + 11 = 18 ÷ 2 = 9
The median is 9.
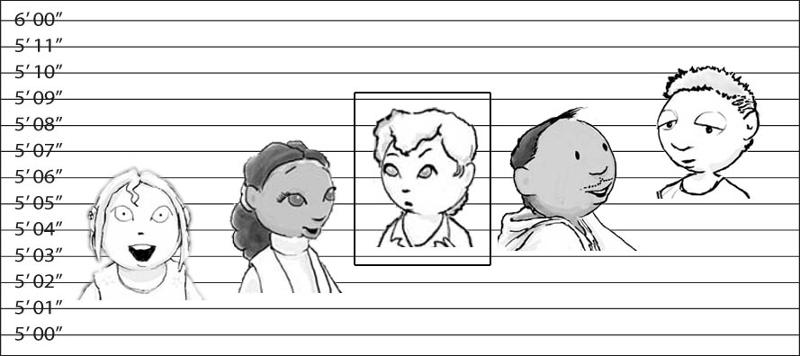
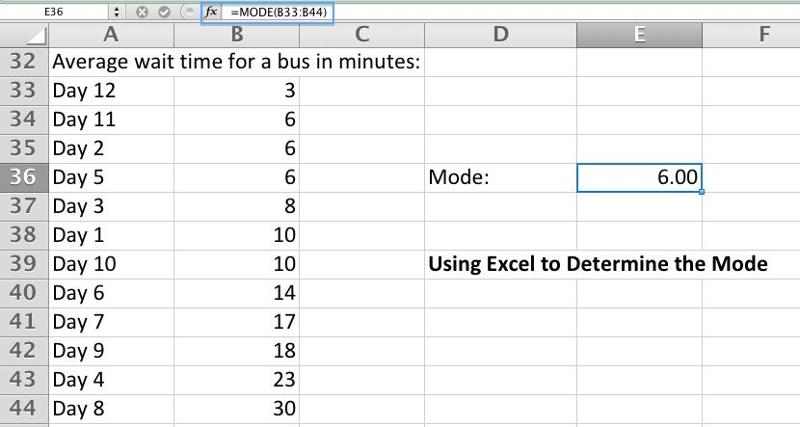
Mode
The most common result (the most frequent value) of a test, survey, or experiment.
Example: 
Find the mode of 5 feet 6 inches, 5 feet 7 inches, 5 feet 10 inches, 5 feet 8 inches, 5 feet 8 inches.
Put the numbers in order to make it easier to visualize: 5 feet 6 inches, 5 feet 7 inches, 5 feet 8 inches, 5 feet 8 inches, 5 feet 10 inches.
The mode is 5 feet 8 inches (it occurs the most - two times).
Significance
The measure of whether the results of research were due to chance. The more statistical significance assigned to an observation, the less likely the observation occurred by chance.
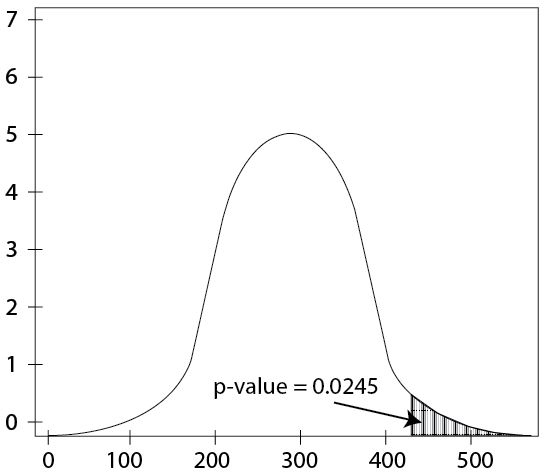
p-value
The way in which significance is reported statistically (i.e. p<.01 means that there is a less than 1% chance that the results of a study are due to random chance). Note that in general p-values need to be fairly low (.01 and .05 are common) in order for a study to make any strong claims based on the results.
Example:
Correlation
The degree to which two factors appear to be related. Correlation should not be confused with causation. Just because two factors are reported as being correlated, you cannot say that one factor causes the other. For example, you might find a correlation between going to the library at least 40 times per semester and getting high scores on tests. However, you cannot say from these findings what about going to the library, or what about people who go to libraries often, is responsible for higher test scores.
r-value
The way in which correlation is reported statistically (a number between -1 and +1). Generally, r-values should be >+/-.3 in order to report a significant correlation.
Check to see what you have learned about statistical terms.

Take the quiz below to see if you understand how to do all of the statistical calculations explained.
Working with central tendencies of data (mean, median, mode) is useful because it makes data more managable. Think of some data you are interested in studying. The temperatures of cities you are considering for a vacation or for relocation could be an example. Which cities have consistent temperatures? Which cities have temperatures that vary greatly over twelve months? How does this statistical data fit into your vacation plans?
List several collections of data that you find interesting. Figure out, make up, or otherwise obtain the details of the data and calculate the mean, median, and mode. Are these three attributes all very similar in value? If so, why do you think this happens? If not, why do you think the attributes vary? Try to collect or build at least one set of data for which the "3 Ms" are dissimilar or "skewed."
Use the following format when listing your collections:
Description of Data:
Values:
Mean:
Median:
Mode:
Analysis:
Note: A downloadable RTF of this activity in the form of a worksheet is included on the left sidebar of this page.
Show/hide comprehension question...
Definitions and examples of r-values and p-values only go so far when understanding these concepts. Familiarity with other common statistical terms will help you as you progress through college.
Using the library or the Internet, construct your own versions of definitions and examples of r-values and p-values. As you search for more interesting definitions and examples, collect and read an article or research study that uses these terms. As you read the article or study, make a list of four or five other terms that are used. Find definitions and explanations for these also.
For example, look for common terms such as population, sample, regression, and distribution. You might also want to consider terms that you see used in the newspaper or in textbooks that you don't fully understand. Use this as an opportunity to become a more active reader as well as a chance to learn more about basic statistical concepts.
Then, compare your new definitions and examples with a classmate's or friend's. Are they similar? Do you have a common understanding of these terms? What other terms have you chosen to find and define? Why are they useful?
Use the following format when listing your definitions and examples:
My r-value definition and example:
My p-value definition and example:
Definitions and examples of other statistical terms:
My comparisons:
Note: A downloadable RTF of this activity in the form of a worksheet is included on the left sidebar of this page.
Show/hide comprehension question...
* Indicates that the original Website is no longer available.
Mean—The average result of a test, survey, or experiment.
Median—The score that divides the results in half.
Mode—The most common result of a test, survey, or experiment.
Significance—The measure of whether the results of research were due to chance.
p-value—The way in which significance is reported statistically. For example, p<.01 means that there is a less than 1% chance that the results of a study are due to random chance.
Correlation—The degree to which two factors appear to be related.
r-value—The way that correlation is reported statistically. It's a number between –1 and +1. If r=0, there is little or no correlation between two variables. When the number is higher, the positive correlation between two variables is greater. Generally, r-values should be >.3 in order to report a significant positive correlation.
Following are the assignments embedded in the Basic Statistics tutorial:
This tutorial should be used before or in conjunction with the Source Evaluation tutorial, for statistics are one method for evaluating source materials. It can also be used in conjunction with the Oral Presentation tutorial.
OPTIONAL - Have students look in the local or college newspaper for examples of statistics. Have them identify the statistics used.
Note: This is an excellent opportunity to utilize and reinforce the cooperative earning techniques found in the Cooperative Learning tutorial.
These points are covered in the iStudy tutorial, but should be emphasized in any discussions.
Through observing both the group's and the individuals' activities, the instructor may assess student performance. Assessment criteria are as follows (instructors supply the percentage weights):
|
Where |
Domain |
Activities |
% |
|---|---|---|---|
|
iStudy Tutorial |
Knowledge |
The learner can define the following statistical terms; Mean, Median, Mode, Significance, P-value, Correlation, and r-value. |
|
|
In-Class |
Comprehension |
The learner can explain the following questions: 1) What does it mean by p<.05? 2) What does it mean by r=-1, r=0, r=1? |
|
|
In-Class |
Application |
The learner can interpret data by using the statistical terms, when given a set of data. |
|
|
iStudy Tutorial |
Synthesis |
The learner can make a set of data him/herself under a certain rule and interpret it by using the statistical terms. |
|
|
|
|
|
100% |